Teenygraph
A teeny tiny interative function plotter written in Python3 focused on simplicity and customisation.


Requirements
The required Python libraries are listed below:
- Tkinter
- Graphics.py
- Getch
Those can be installed with:
python3 -m pip install graphics.py getch
sudo apt install python3-tk
Initializing
Import tg.py. For the sin() function, math library is also required.
>>> import tg
>>> import math
Select a predefined theme (dark.json or paper.json). For instance:
>>> tg.theme("dark.json")
Call the init function
>>> tg.init(800,10,1)
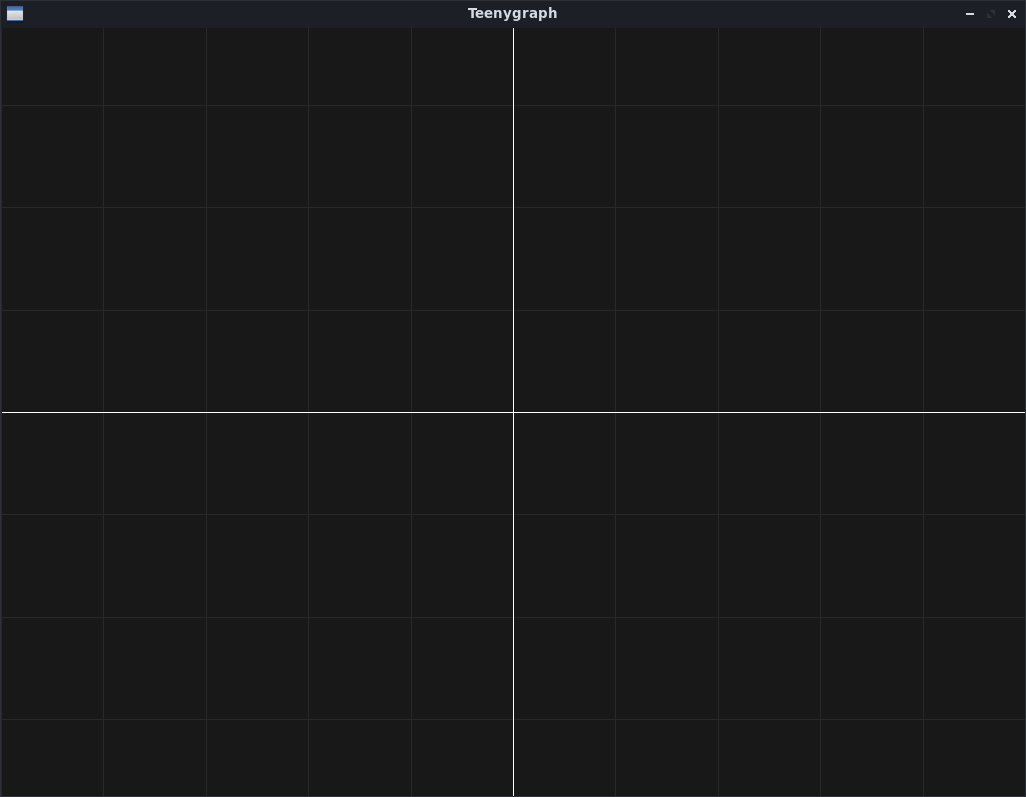 An empty graph will be created with the following properties:
Window size: 800x768
X axis size: 10 (-5 to 5)
Grid interval: 1
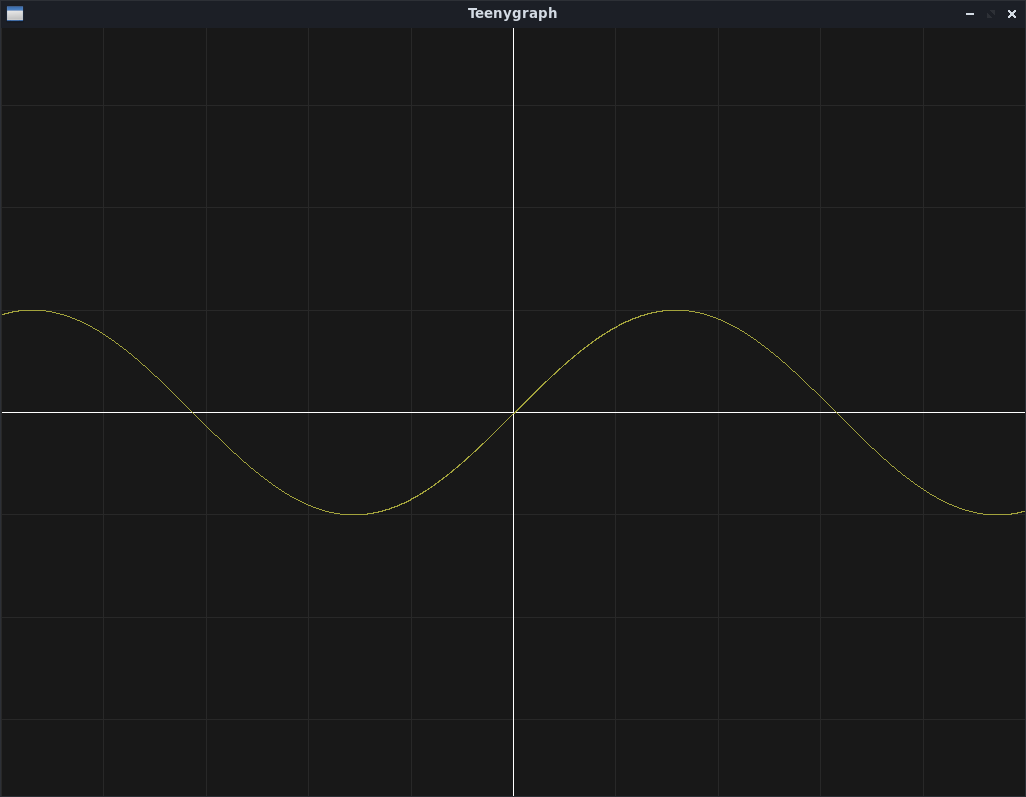
Define a function that receives a value (x) and returns another (math.sin(x)):
>>> def Sin(x):
...     return math.sin(x)
...
>>>
So, the graph will read:
x: x
y/f(x): math.sin(x)
Plot the defined function:
>>> tg.plot(Sin)
More examples are avaliable on examples.py.
Customizing
Color Themes
New JSON color themes can be created acording to the model below:
{
  "Color1": [r,g,b],
  "Color2": [r,g,b],
  "Color3": [r,g,b],
  "Color4": [r,g,b],
  "Color5": [r,g,b]
}
- R, G and B correspond to RGB values (0-255).
- “Color1”: Background color;
- “Color2”: (x,y) axis color;
- “Color3”: Grid color;
- “Color4”: Function color;
- “Color5”: Markers color.